

Solana’s price rose 2.9% over the past 24 hours and broke above a key inverse head-and-shoulders neckline on the 12-hour chart. This breakout typically signals a trend reversal and offers more than 50% upside potential.
But the breakout is happening while long-term holders exit aggressively and leverage builds quickly. These conflicting signals now create a classic bull trap risk where early buyers could get caught if momentum fails.
Breakout Shows 50% Upside Potential
Solana recently broke above the neckline of an inverse head-and-shoulders pattern. A descending neckline is easier to break because resistance weakens over time as sellers accept lower exit prices. This increases breakout probability but also raises fakeout risk because the breakout lacks strong resistance clearance.
The breakout also pushed Solana above its 20-period exponential moving average, or EMA, a trend tracking indicator. This level often signals trend strength returning.

But the last time Solana broke above this same moving average earlier in February, the move failed, and the price dropped nearly 12% afterward.
At the same time, a hidden bearish divergence is forming between February 2 and February 21, at press time. During this period, the Solana price formed a lower high while the Relative Strength Index formed a higher high.
Want more token insights like this? Sign up for Editor Harsh Notariya’s Daily Crypto Newsletter here.
This divergence signals weakening price strength even while momentum indicators rise. It usually appears before pullbacks and suggests the breakout could fail if buyers do not maintain control. The same divergence occurred between February 2 and February 15, leading to the 12% correction mentioned earlier.
This bearish divergence remains active unless Solana breaks above $85.70. A move above this level would temporarily weaken the immediate divergence signal. But the broader Solana price risk remains until stronger resistance levels are broken.
Open Interest Jump and Positive Funding Rate Show Trap Conditions
Derivative data confirms traders are reacting to the breakout. Open interest increased from $1.96 billion on February 20 to $2.08 billion on February 21. This represents a 6.1% increase in just one day.
Open interest measures the total value of active futures contracts. Rising open interest during breakouts shows traders are opening new positions rather than closing existing ones.
At the same time, funding rates turned positive to 0.0016% after being negative previously. Funding rates represent payments between long and short traders. Positive rates mean long traders are paying short traders, showing bullish positioning.
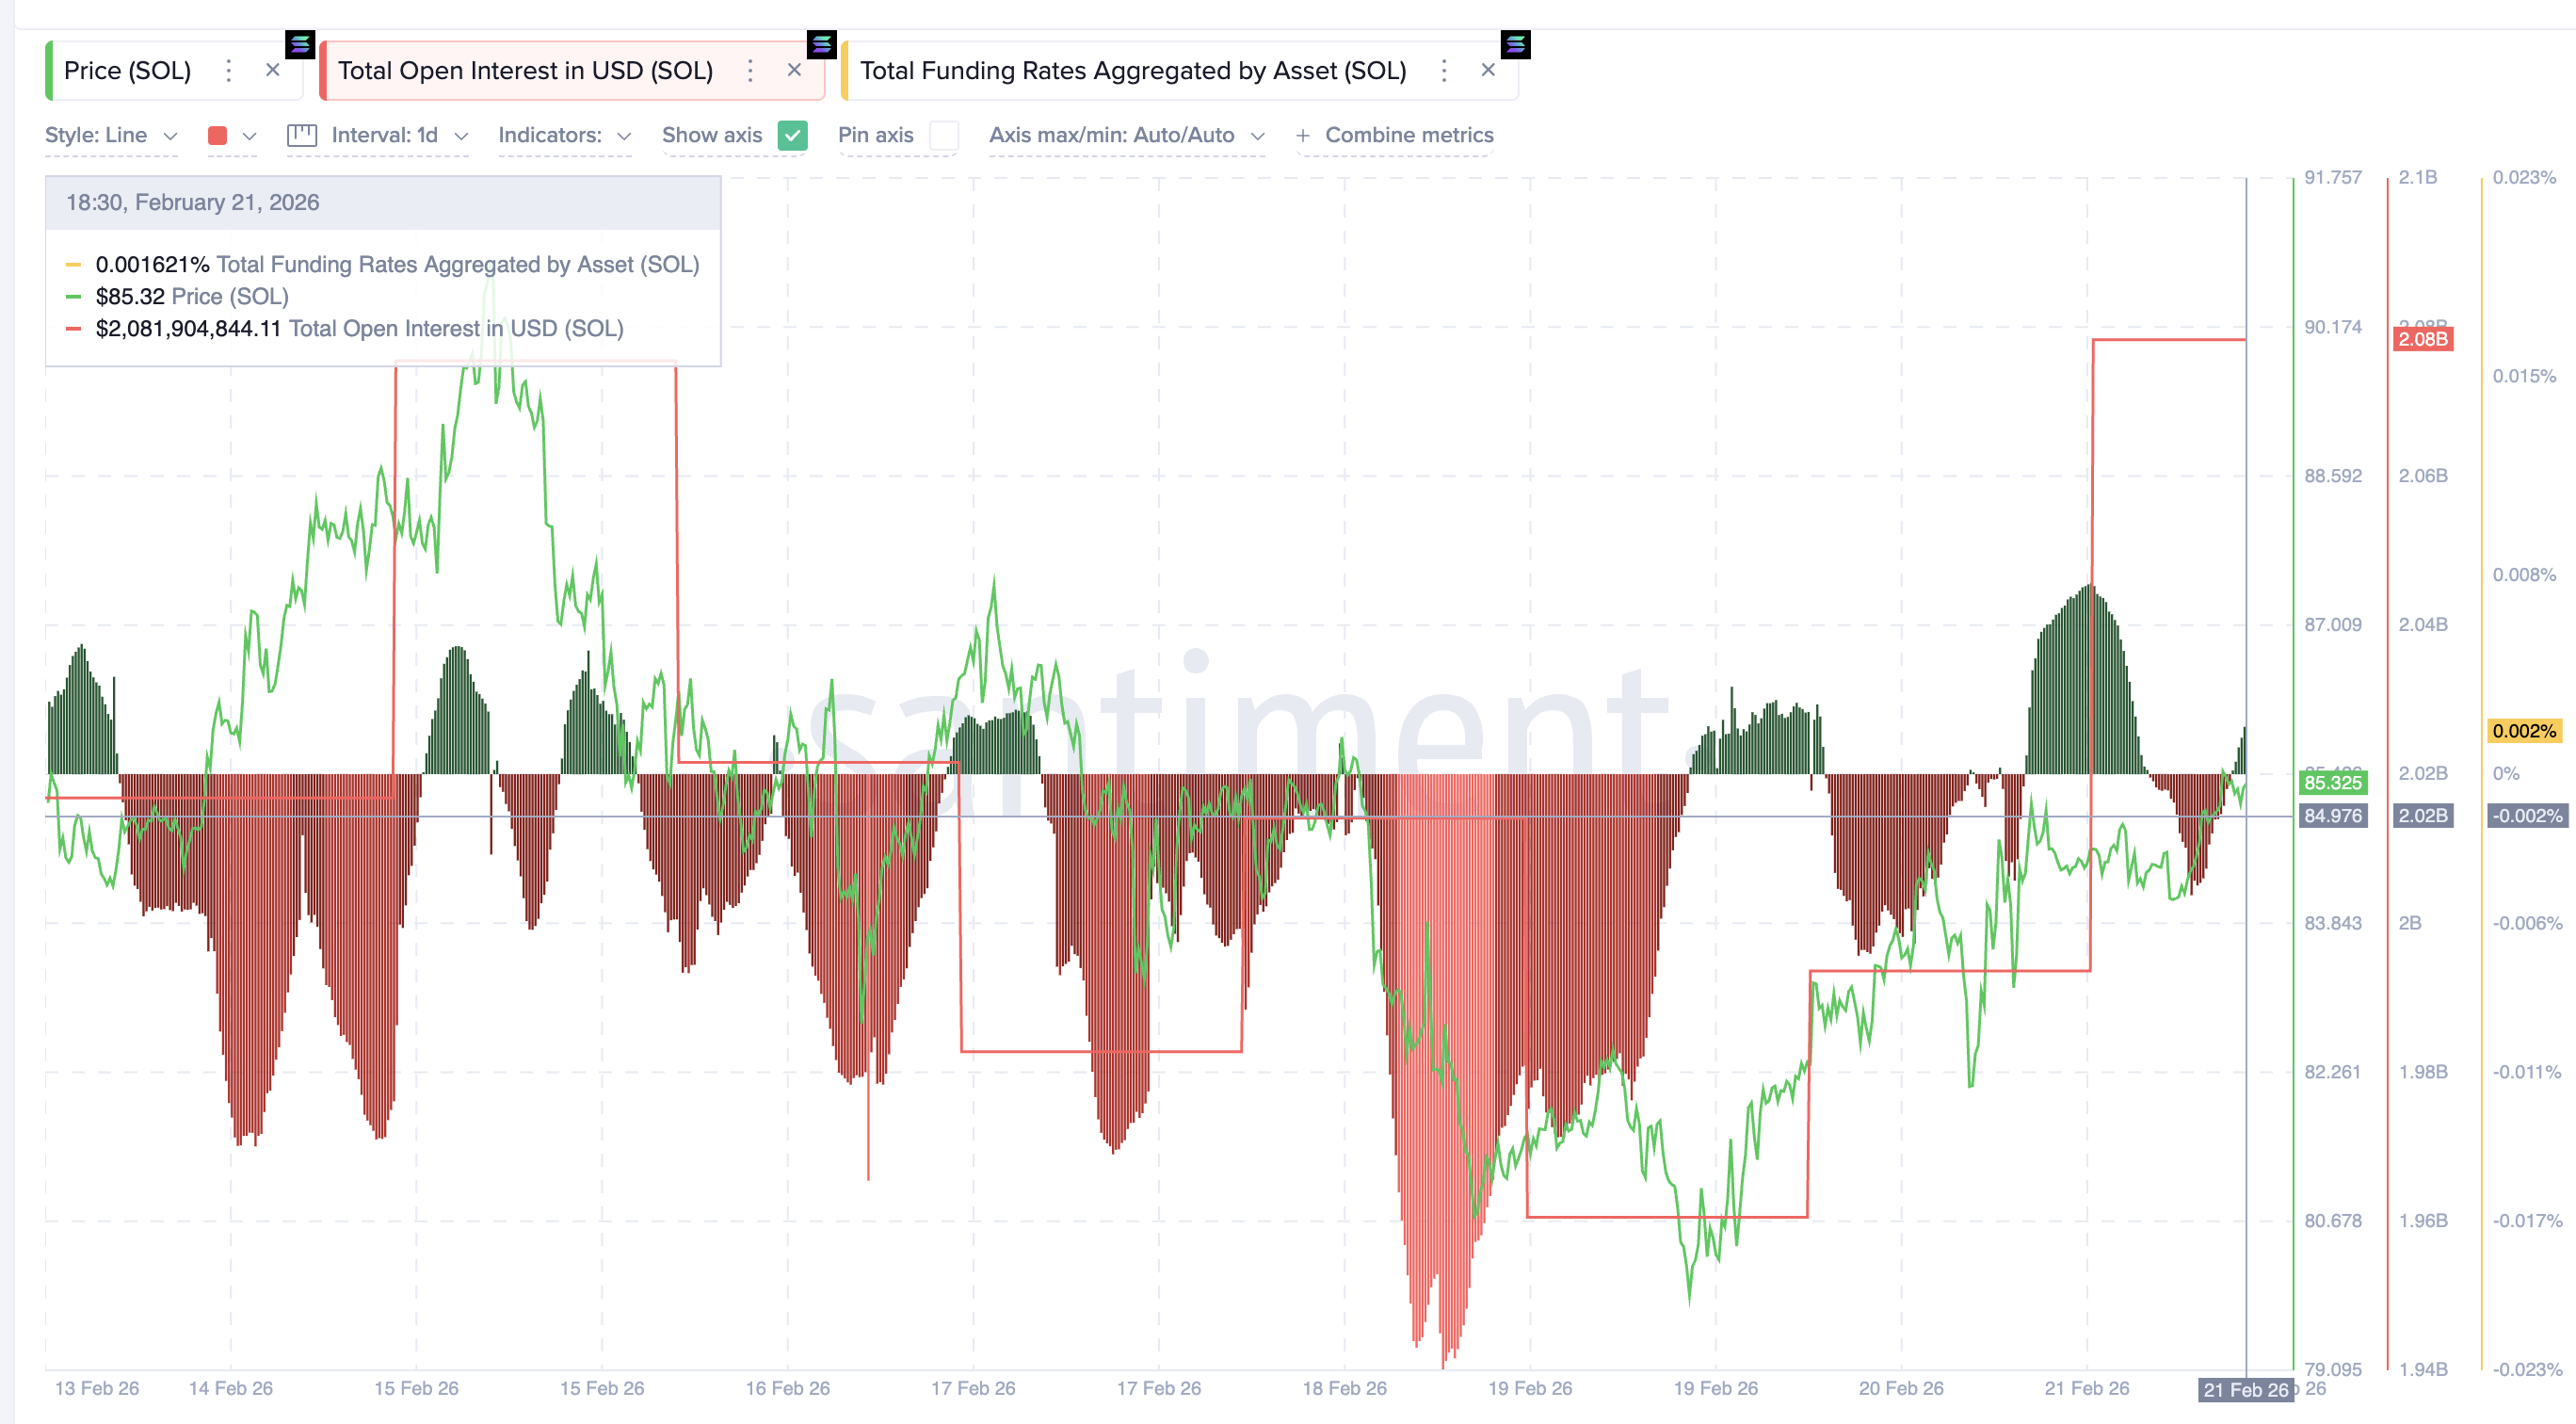
This combination confirms new leveraged longs are entering based on the breakout signal. This matters because bull traps require buyers to trap. Rising open interest and positive funding rates confirm traders are positioning for further upside. If the breakout fails, these same leveraged longs could be forced to sell, accelerating the downside move.
Holder Net Position Drop Shows Long-Term SOL Investors Are Exiting
The most important warning comes from long-term holder behavior. The Hodler Net Position Change metric tracks the 30-day rolling net change in supply held by long-term holders. These are investors holding coins for 155 days or longer. This metric reveals whether experienced investors accumulate or distribute.
On February 8, long-term holders added nearly 1.98 million SOL. By February 20, that number dropped to almost 0.99 million SOL. This represents a decline of almost 50%.
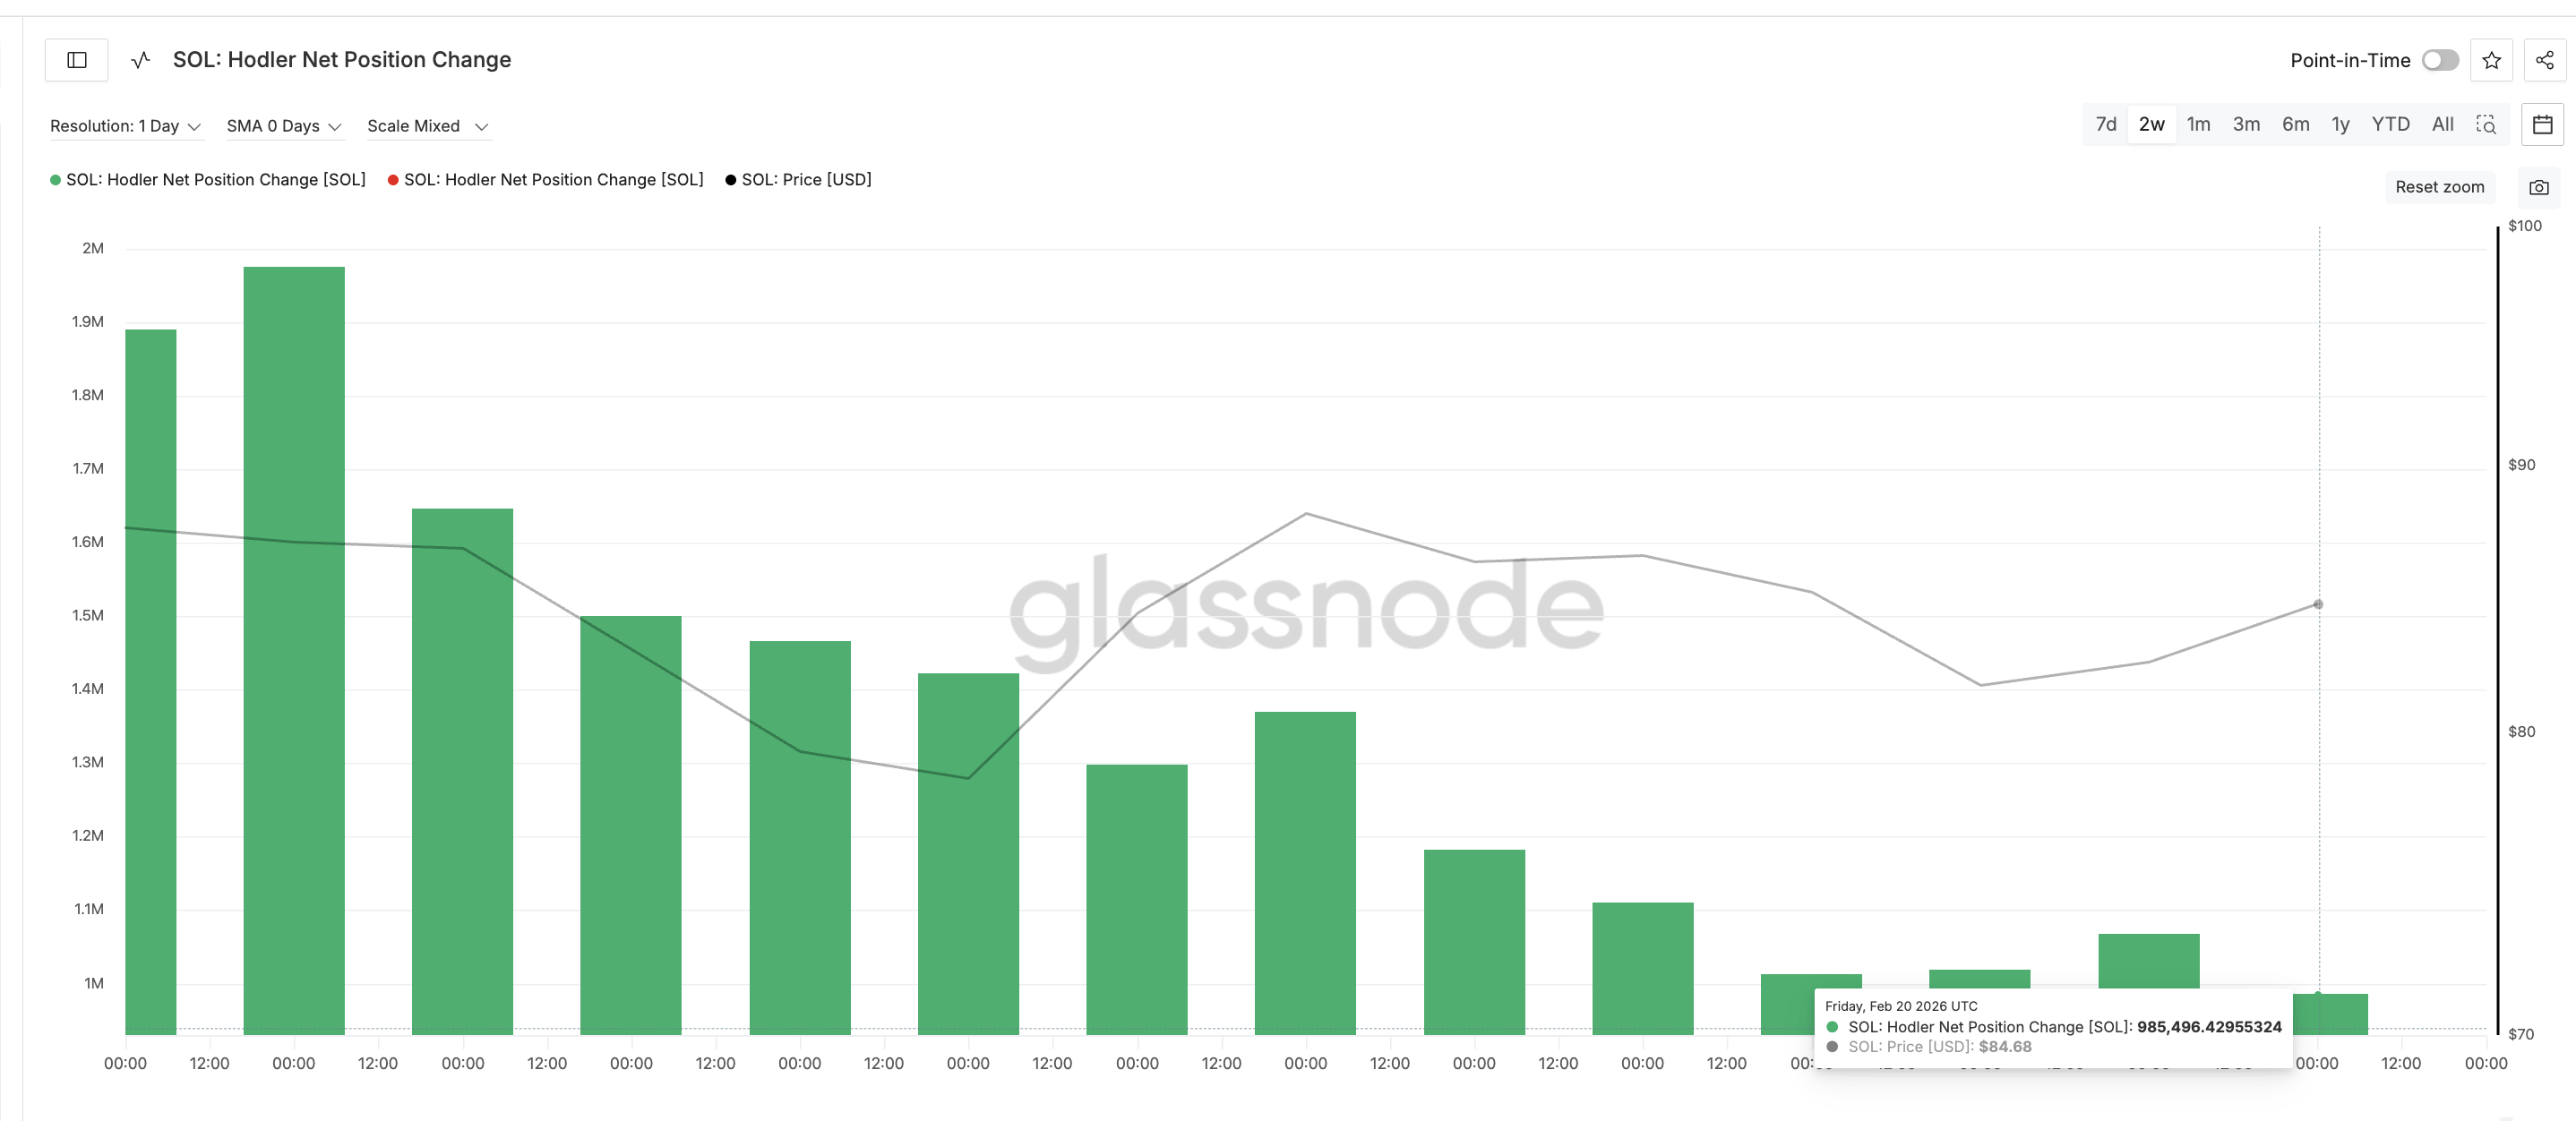
This means long-term holders reduced their accumulation by half, while the bullish inverse head-and-shoulders pattern developed.
Long-term holders typically accumulate before rallies and distribute near local tops. The slowish accumulation, or rather exits, weakens breakout sustainability.
Cost Basis Cluster at $91 Creates Final Solana Price Confirmation Level
Cost Basis Heatmap data reveals where investors last bought their tokens. These zones act as strong resistance because holders often sell near their break-even levels.
The strongest nearby cluster lies between $87 and $88, where nearly 9.12 million SOL have been accumulated. This creates immediate resistance.
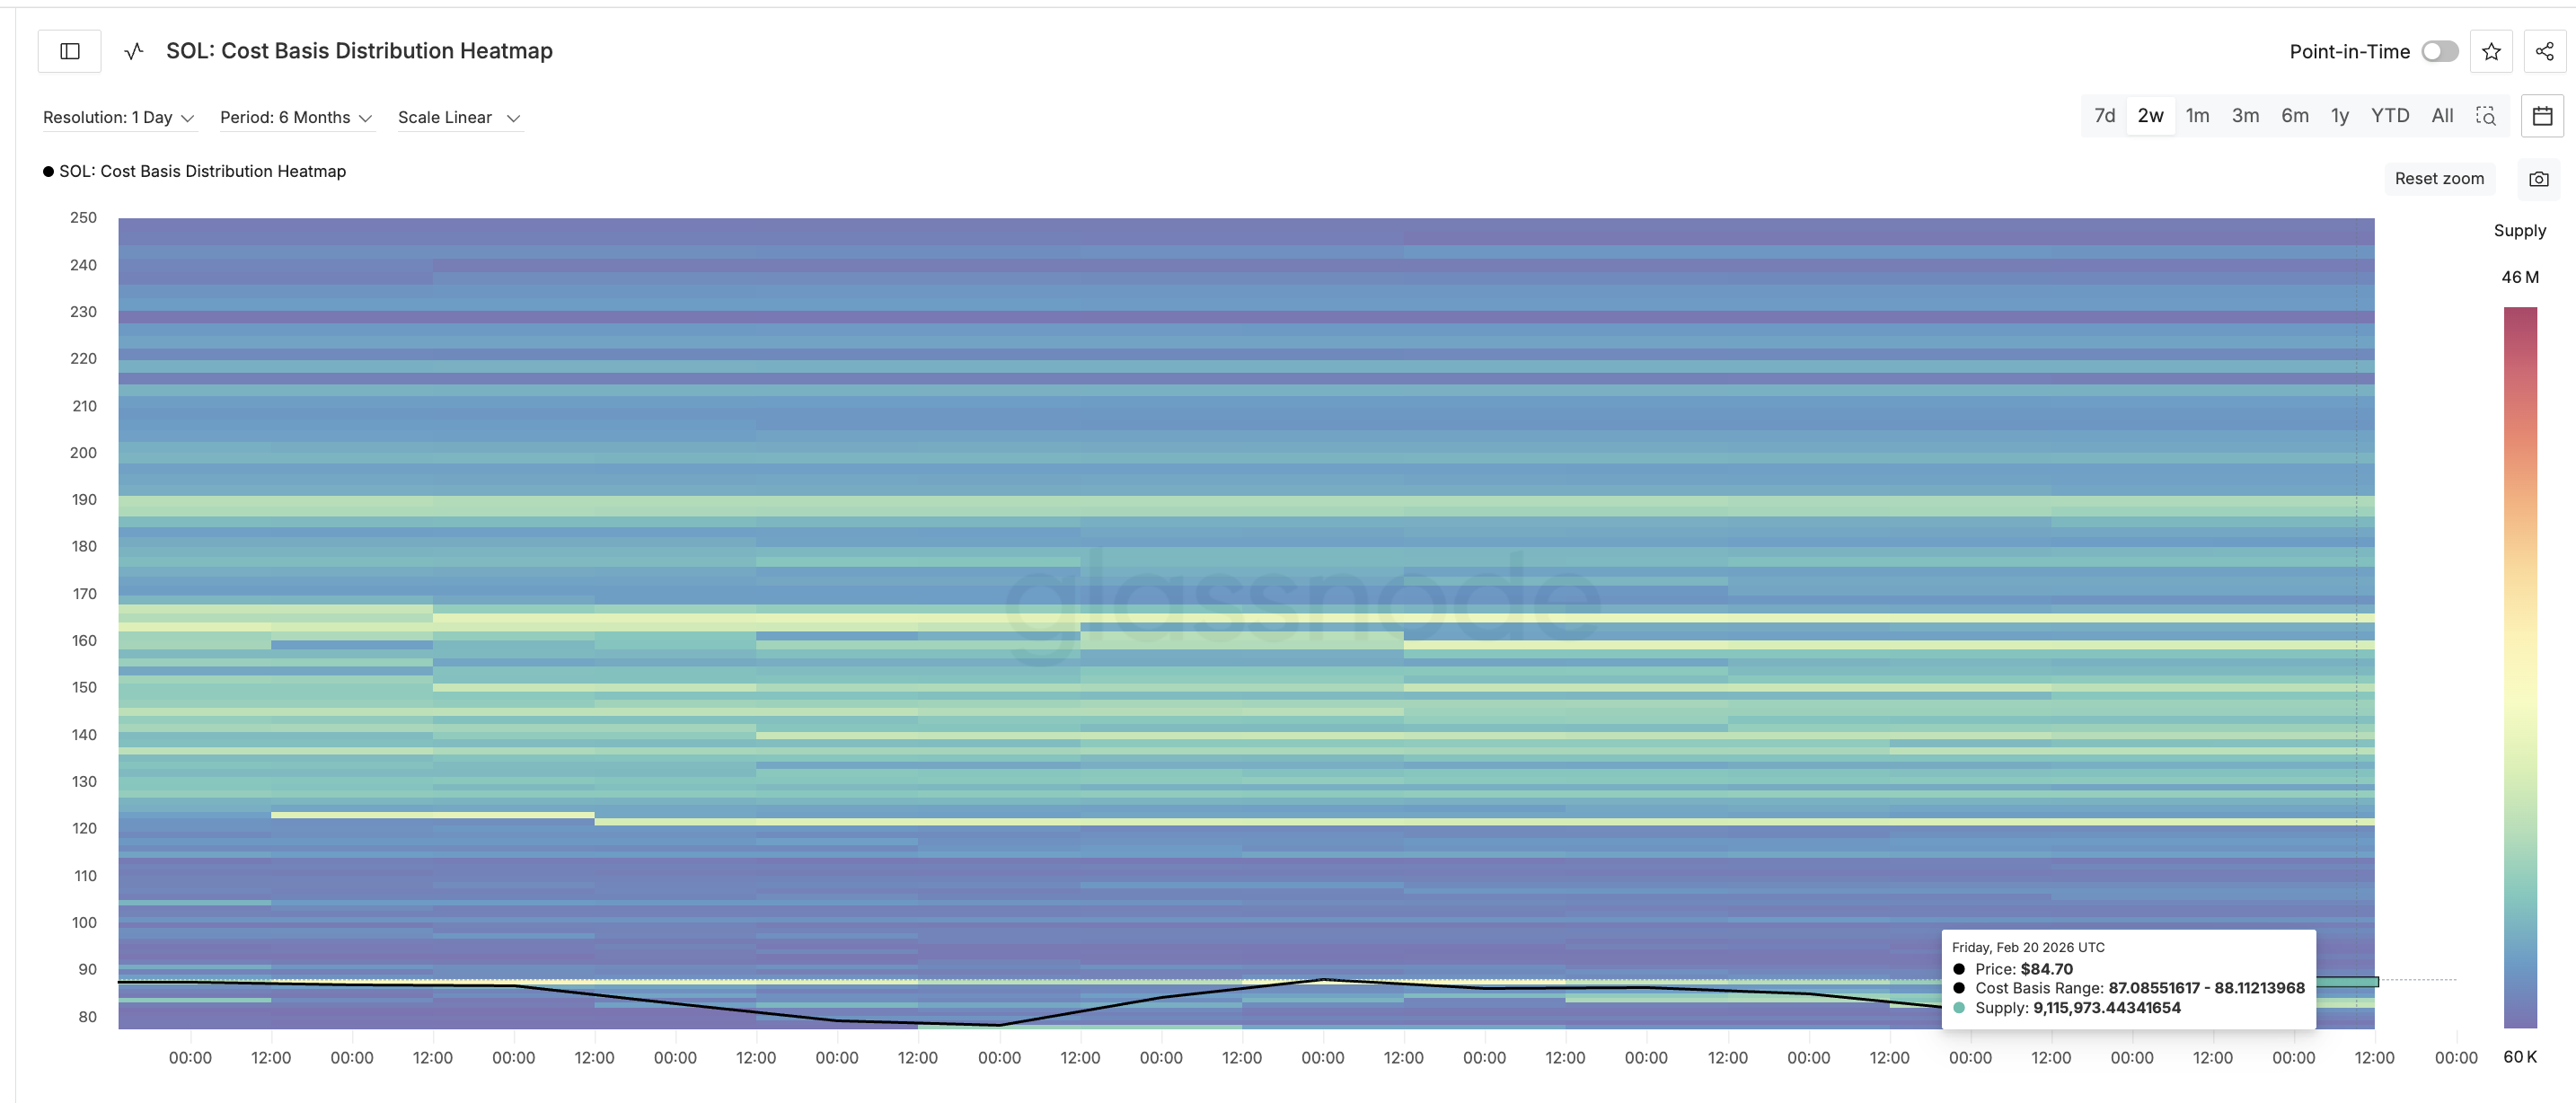
Breaking above $85.70 is the first important step. It would weaken the hidden bearish divergence and strengthen the breakout. But the more critical level sits at $91.09.
This level sits above the nearest major cost basis resistance. Breaking above it would absorb overhead supply and confirm buyers are strong enough to sustain the breakout and haven’t been tempted to sell at break-even.
If Solana clears $91.09, the inverse head-and-shoulders breakout target near $129.78 becomes achievable. This represents approximately 50% upside from the breakout line.
While upside potential exists, downside risks remain significant. If Solana falls below $78.88, the inverse head-and-shoulders pattern weakens, and the breakout begins to fail.
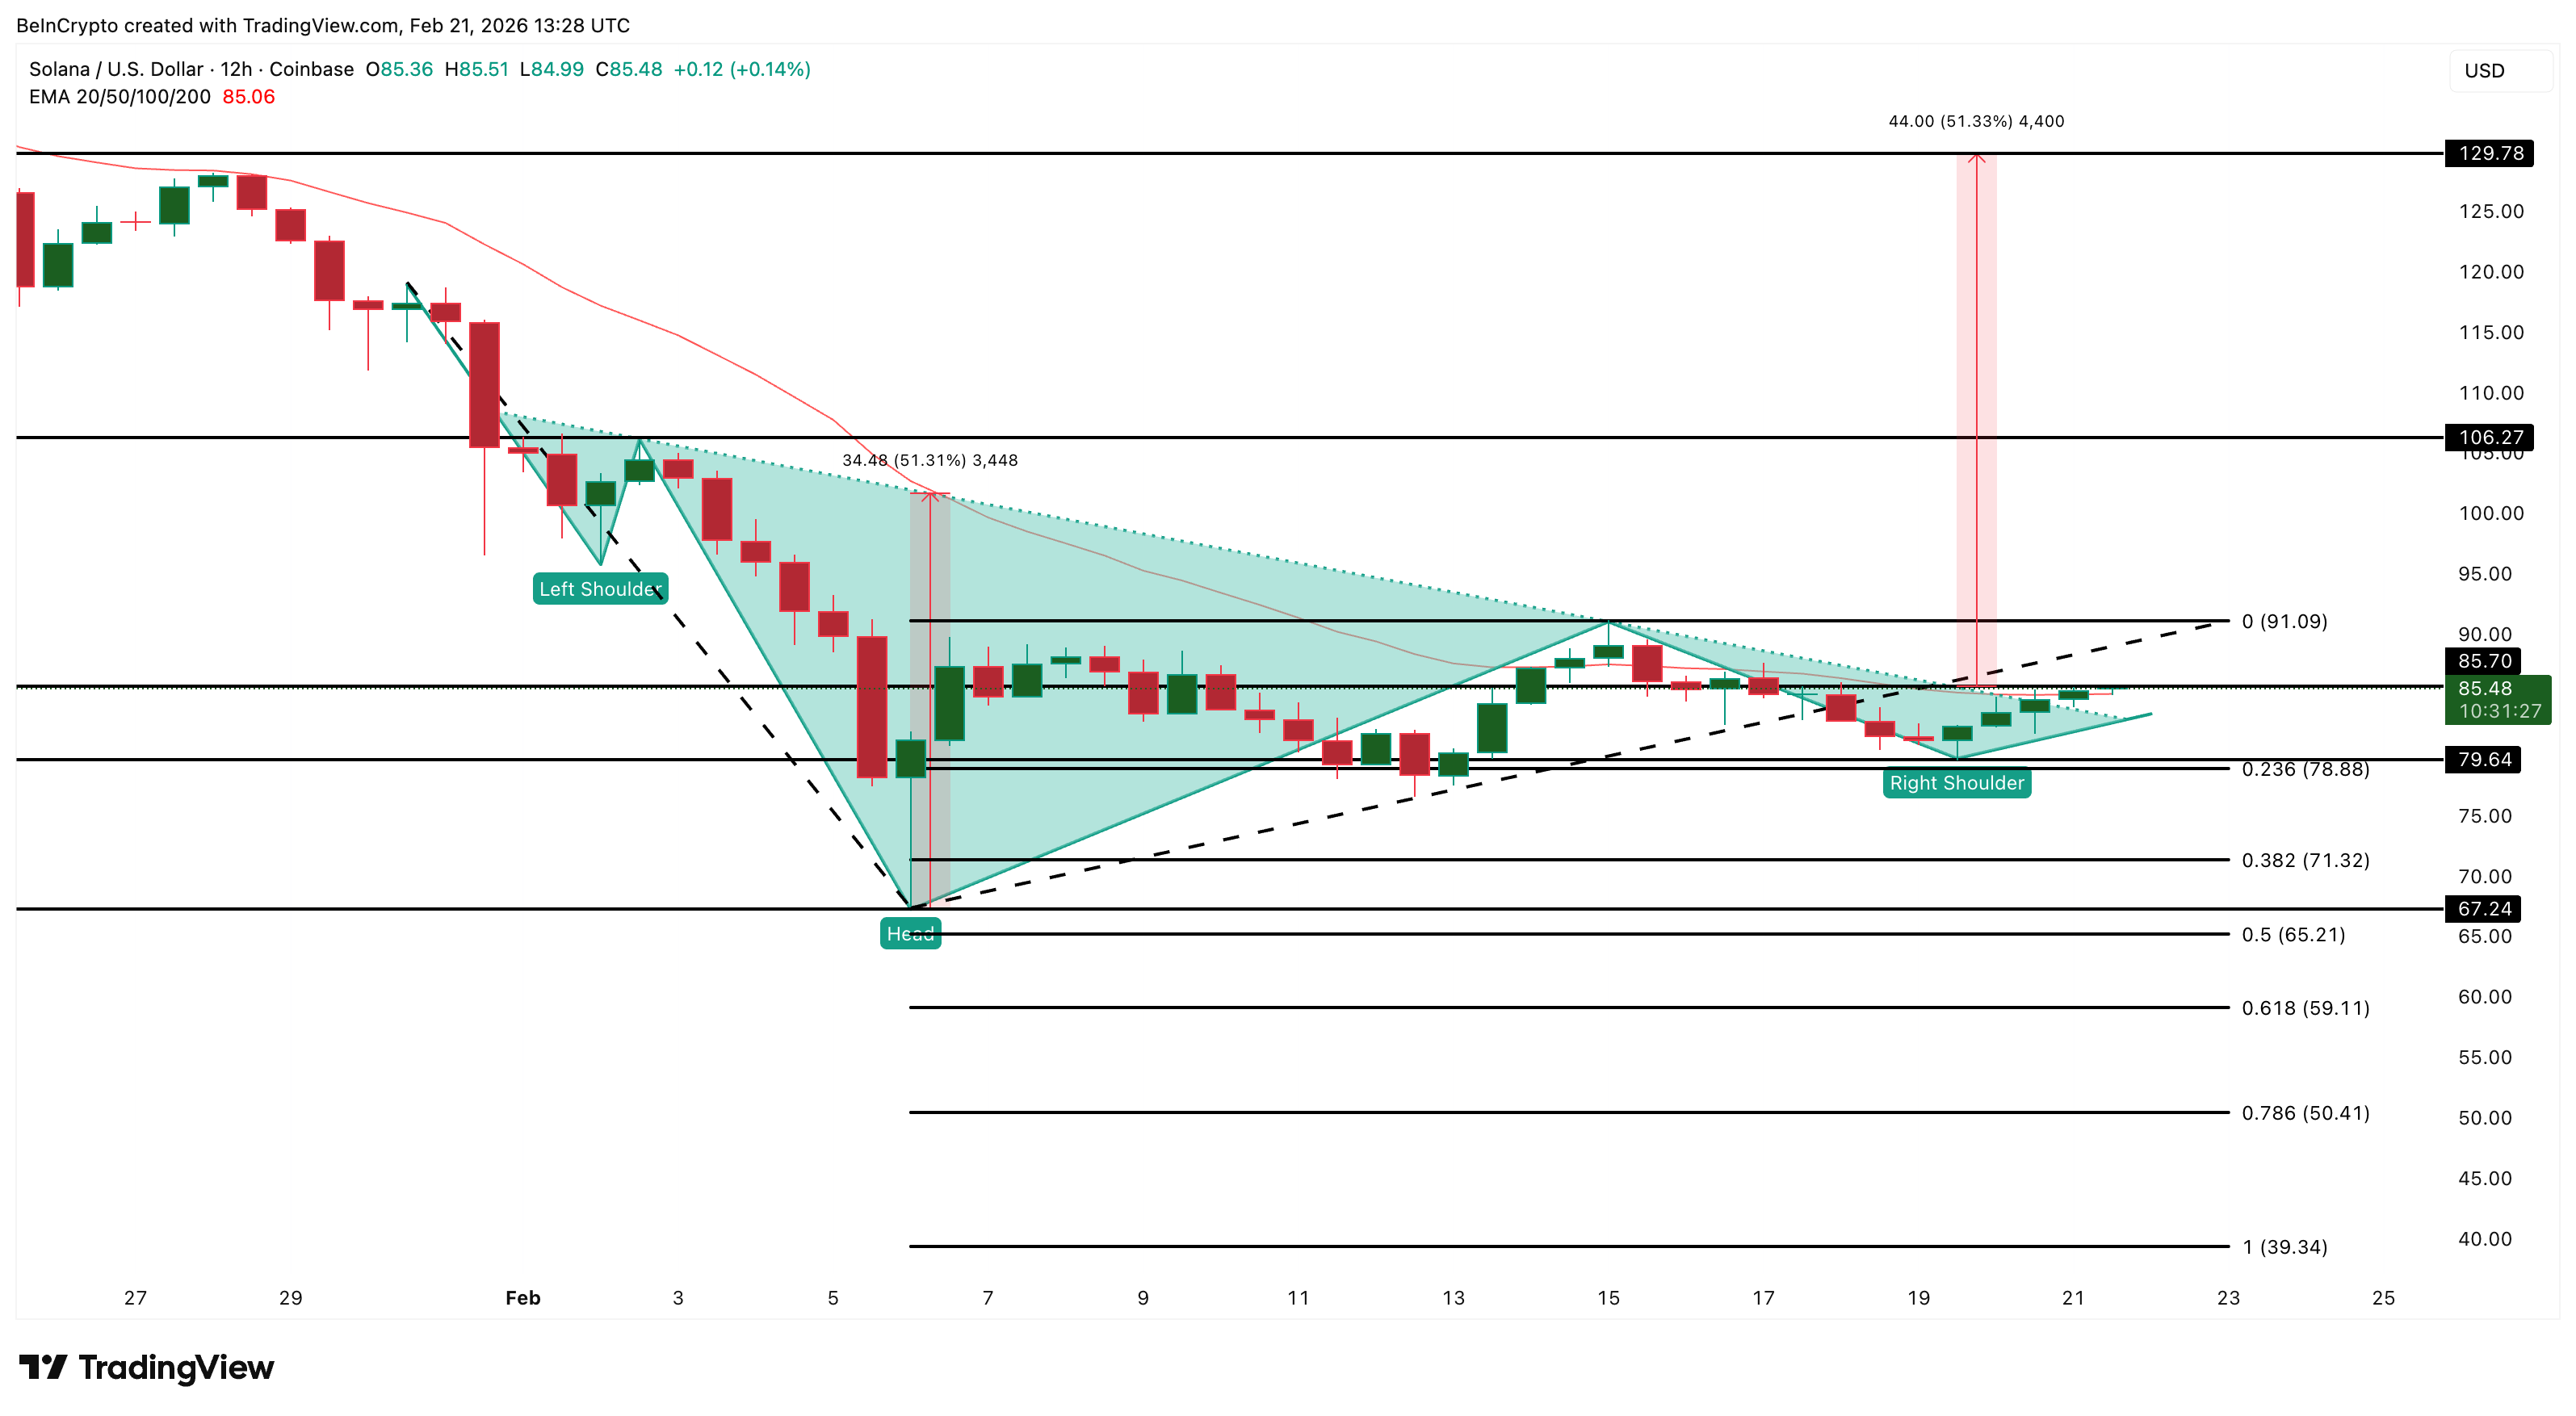
A drop below $67.24 would fully invalidate the pattern. Such a move would also likely trigger long liquidations due to the recent leverage buildup. Solana now sits at a critical decision point.
Open interest rising 6.1%, funding rates turning positive, and a 50% drop in long-term holder supply all show conflicting forces.
Breaking above $91 confirms the breakout and opens the path toward $129. Falling below $78 increases bull trap risk. Dropping below $67 confirms the breakout has failed completely.